Year 10 Economics & Business
Hypothetical Economy
What is Australia’s economy like?
Last updated 15 May 2019
If you have any problems with these resources or need further help, please contact the Teacher Librarians via mailto:lis@mlc.wa.edu.au
Look at the two graphs below and compare the world economy with Australia’s
Using the graph, describe what happened to the world’s economy in 2007-2008?
What was this event and how did Australia not experience the same change on the graph?
Scroll to the section called The policy response to the global crisis and recession.
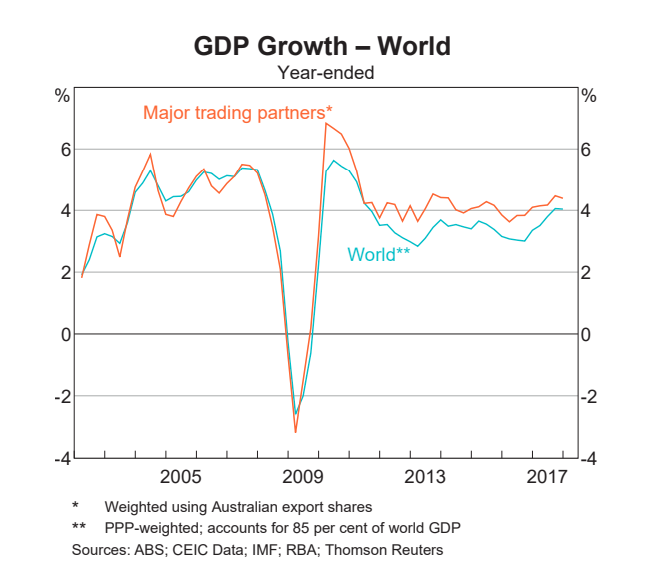
Source: RBA Chart Pack May 2018
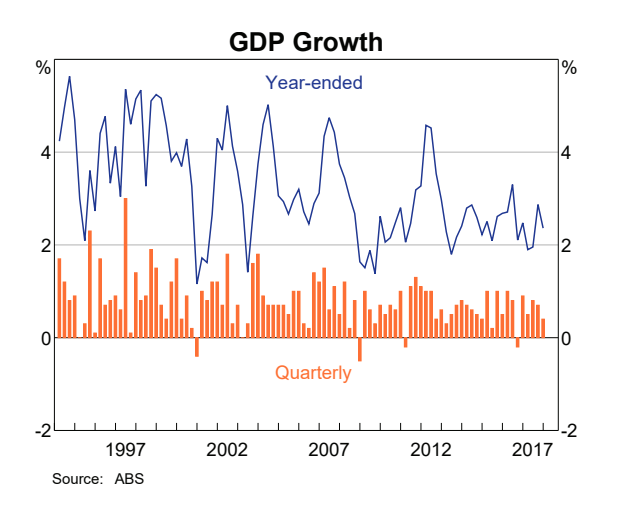
Source: RBA Chart Pack May 2018
Indicator
2016
2017
2018
Source
2.4%
2.4%
2.3%
0%
0%
-0.1%
1.5%
1.9%
1.8%
5.8%
5.5%
5%
64.9%
64.9%
65.5%
0.323
–
0.34
2nd
–
3rd
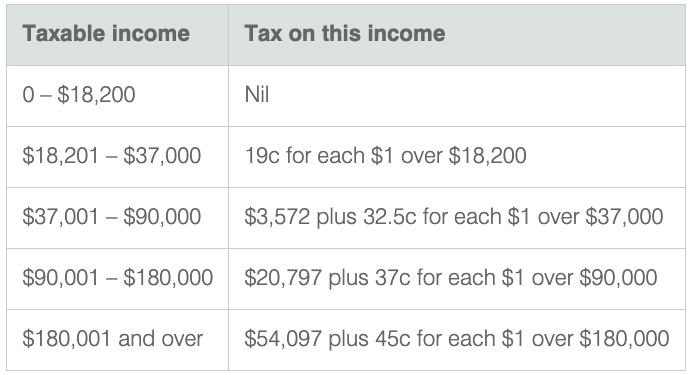
These are the tax rates for individuals for 2018-19
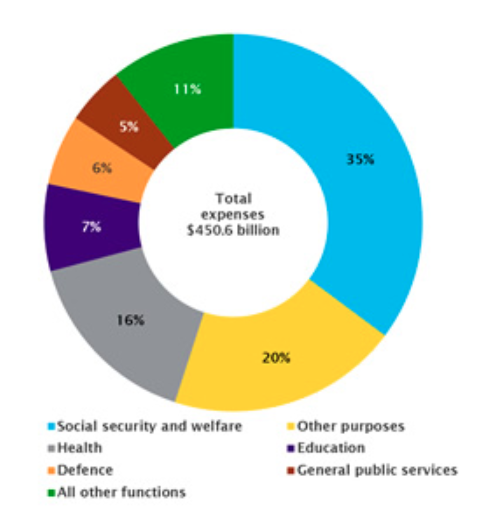
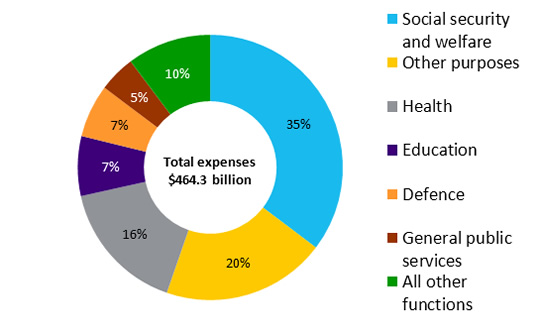
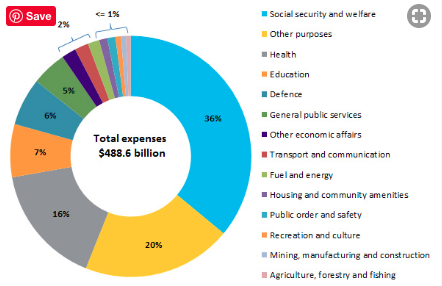
The graphs below show the areas where the Australian Government has spent their money.
How do the percentages compare to your hypothetical country?