
(Rossen, 2012)
An infographic is a popular way to convey information.
“Infographics are visual designs that help to explain complicated data in a simple way” (Smith, 2012) but simply putting words and pictures together doesn’t make your piece of work an infographic.
A successful infographic should be:
- Relevant
- Interesting
- Understandable
- Simple
- Accurate
Follow the steps below to create an infographic that is not only useful but one that everyone will want to look at.


Step 1 - Research and gather your data
Before deciding on a format you will need to do your research first.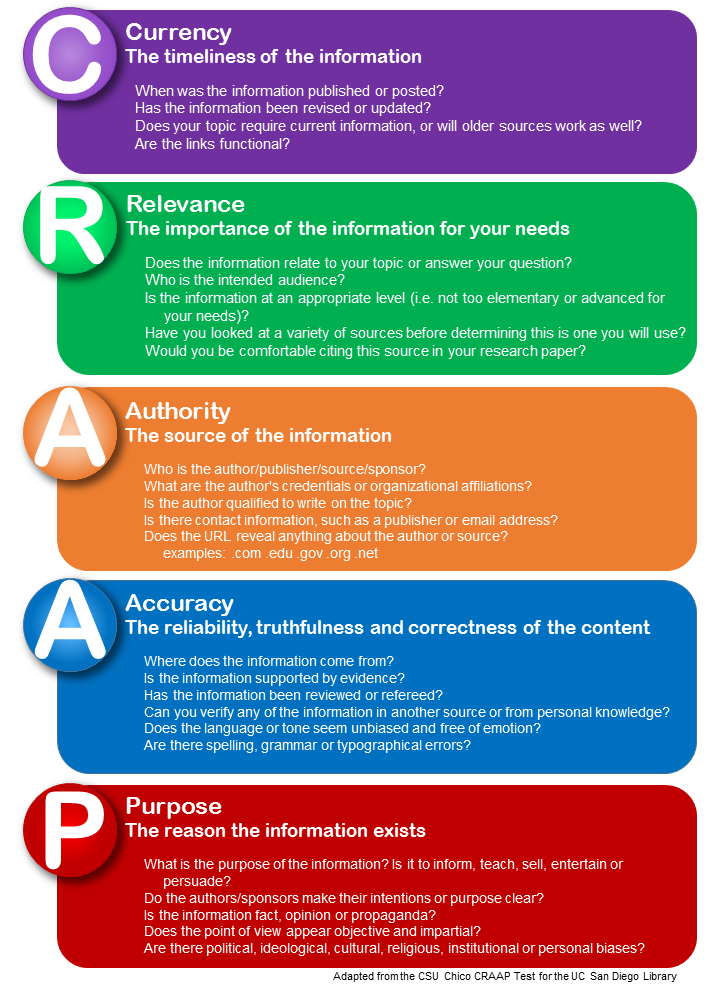
“Your infographic will only be as credible as its least credible source” (Jordan, 2015)
Make sure you are using quality information sources. To ensure the websites you’re using are reliable why not apply the CRAAP test.

Also don’t forget the research advice in the Google…like a pro! document. Make sure you are using the advanced search to find exactly what you need.
Step 2 - Analyse your data
- Get to know your data.
- Can the data be categorised in any way?
- Can the data be organised chronologically?
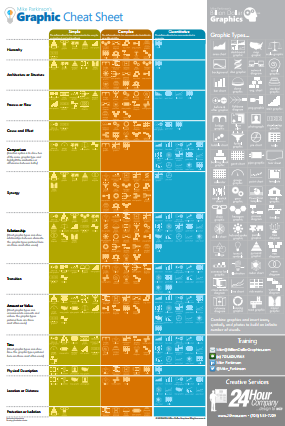
- Instead of looking at the data with a pre-conceived idea, look at the data to see what it actually shows. Let the data tell the story and see if it lends itself to particular format.
- Draw conclusions
Step 4 – Draft your infographic
This part can either be done on paper, within a Word or Pages document or even within the infographic tool itself.
Step 5 – Select a tool to help design your infographic
There are a number of tools that can used to produce an infographic. Here are some of the most popular ones:
Step 6 - Gather responsibly sourced images
When searching for images you need to remember:
- Google does not own the images
- Each image found using Google Images belongs to the person who either took the photo or created the image
- Not all images available via Google Images are free to use. Many sites will expect you to pay to use the images from their site. You may have seen images like this with a watermark.


- It is illegal to use these images without payment or to remove the watermarks.
As a student, you are allowed to use images for the purpose of study and research but you will be expected to acknowledge the creator of the image.
To find images that are free to use why not look for Creative Commons material. ![]()
Not sure what Creative Commons is? Have a look at the CC License Fact Sheet
Places to search for Creative Commons images:
Other options
Step 7 – Take into account good design principles
Overall, make sure you keep the same style through your infographic.
Graphics
- Make sure all images have consistent lighting and style
- Select images that will make your data and information easiest to understand.
- Just because something looks cool, doesn’t mean it will be the most effective way to show your data.
Colour
- Decide on a colour scheme before creating the infographic
- The best infographics use only two or three main colours with a few extra as accent colours.
- Remember that colours that are too bright or too dark are not attractive to the eye
- Colour can also be used to colour sections.
- To help create a colour scheme, the following sites may be useful:
- Adobe Color CC
- Color Palettes
This is a fantastic site as it gives a nice display of colours that complement each other.
- Material Design Palette
This site allows you to pick 2 colours and it will suggest colours suitable for text and other complimentary colours.
Text
- For your title – choose a strong bold header
- Limit the amount of text. The best infographics have visual impact.
- Make sure the text is readable and try to avoid decorative scripts.
- Limits fonts to a maximum of three different types
- Keep text in “bite size” chunks
References
- Farrant-Gonzalez, T. (2015). Create the perfect infographic in 3 steps. Retrieved from http://www.creativebloq.com/infographic/create-perfect-infographic-91516715
- Gretter, S. (2015). Infographics for learning in five steps. Retrieved from http://insideteaching.grad.msu.edu/infographics-for-learning-in-five-steps/
- Infographics: creating infographics. (n.d.). Retrieved from http://guides.library.upenn.edu/infographics/creating
- Jordan, C. (2015). How designers do it: 15 easy steps to design an infographic from scratch. Retrieved from https://designschool.canva.com/blog/create-infographics/
- Rossen, K.L. (2012). What is an infographic [image]. Visually. Retrieved from https://visual.ly/community/infographic/how/what-infographic
- Smith, J. (2012). 10 steps to designing an amazing infographic. Retrieved from https://www.fastcodesign.com/1670019/10-steps-to-designing-an-amazing-infographic
- The ultimate infographic design guide : 13 tricks for better designs. (n.d.). Retrieved from https://venngage.com/blog/infographic-design/